0
Skip to Content
Get Help
How to Help
Overview
Donate Food
Donate Funds
Volunteer
Schedule a Food Pick-up
Host a Food Drive
Logos & Graphics
Learn
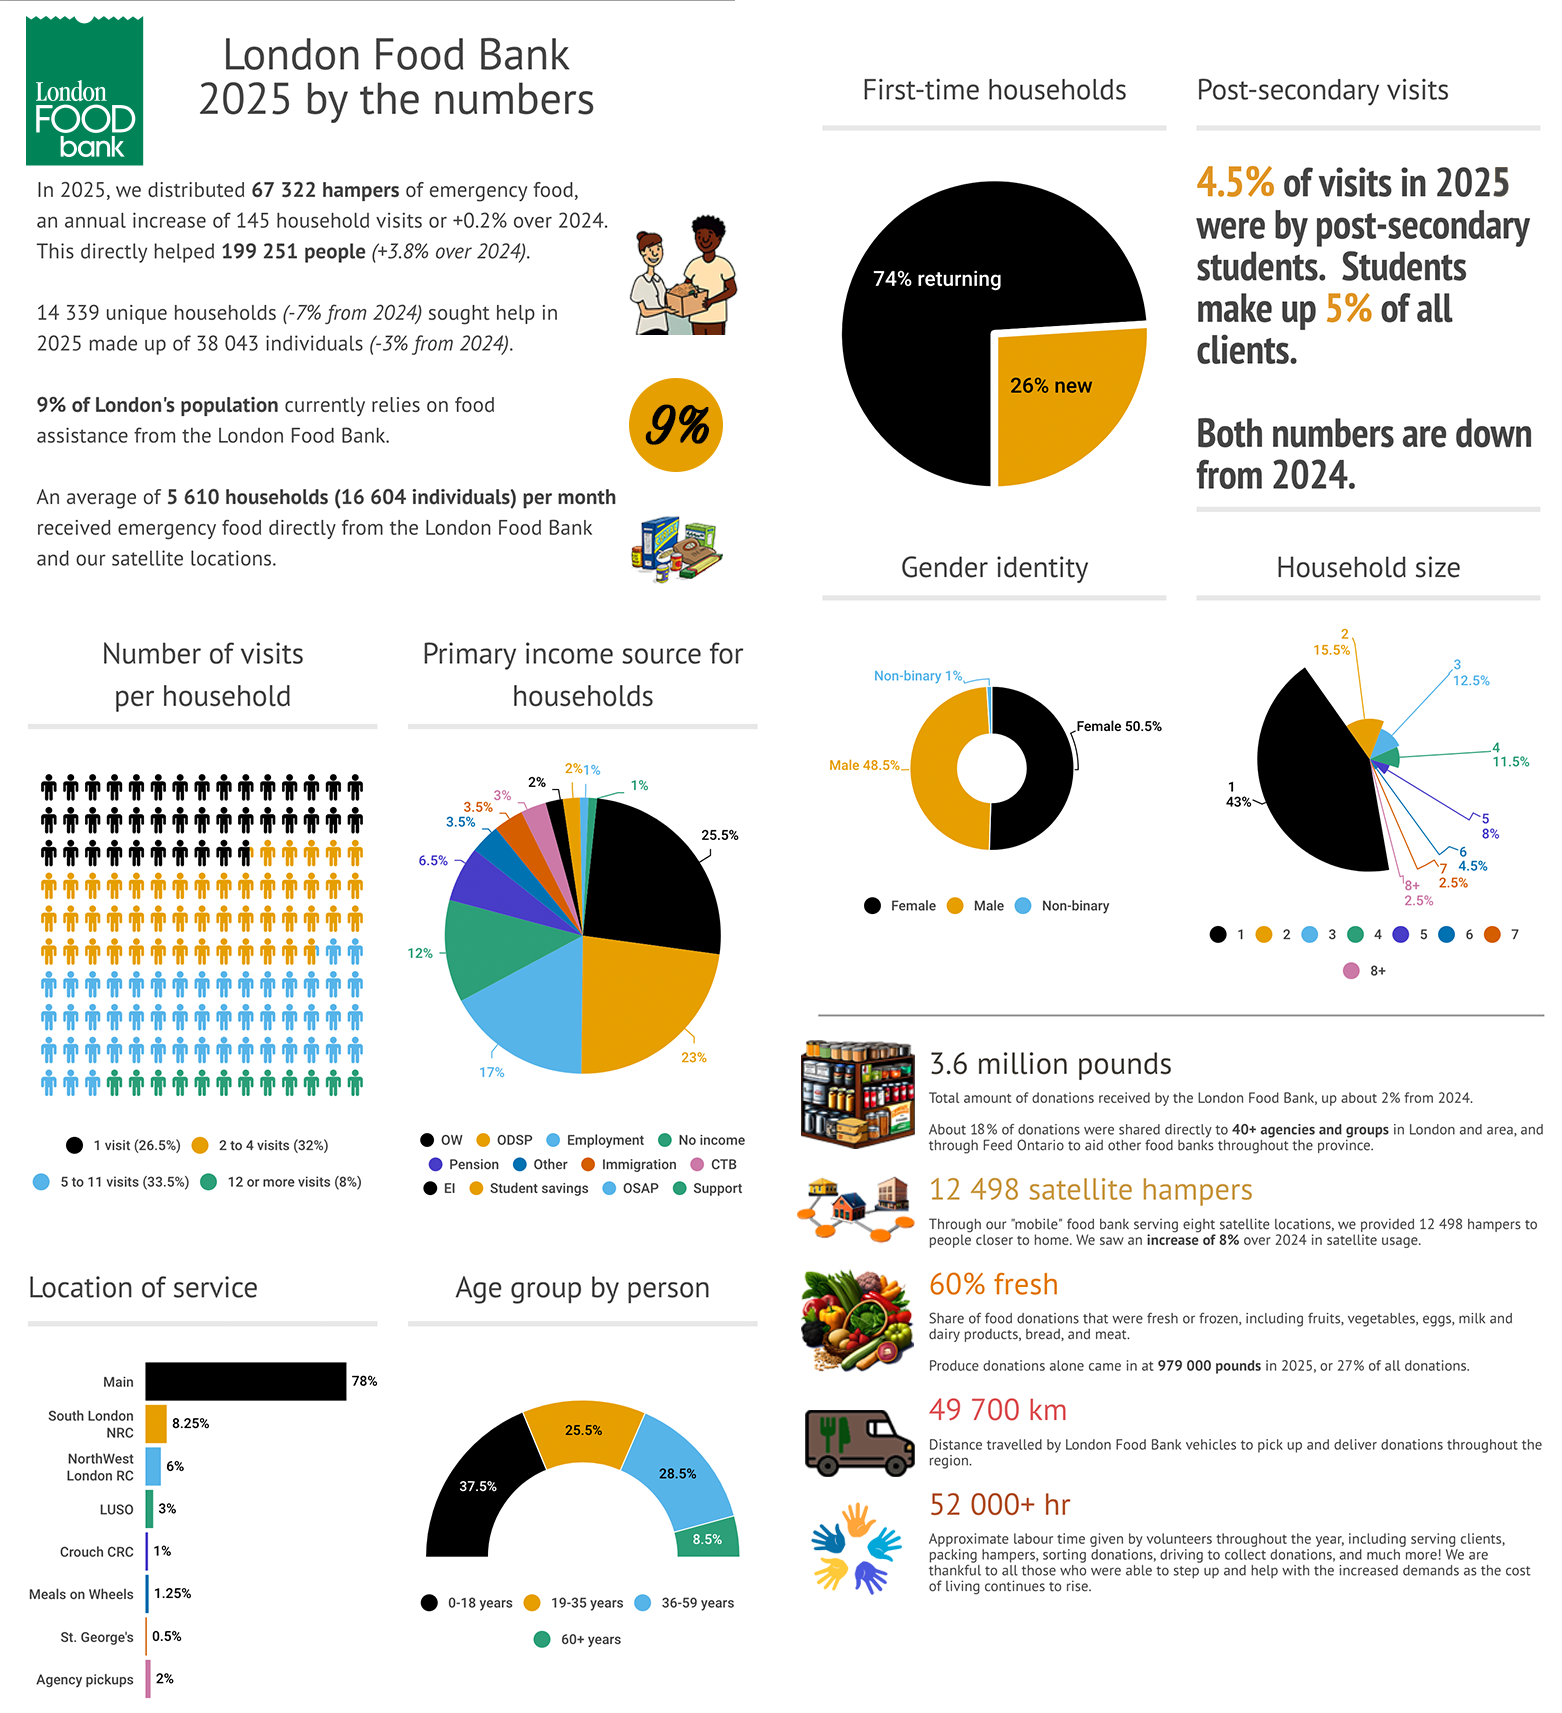
LFB by the numbers
Hunger in Ontario
Hunger in Canada
From the Food Bank
Food Waste Matters
Food Bank on Film
FAQ
Our Programs
Arts 4 All Kids
Adopt a Plot
Community Harvest
Plant a Row, Grow a Row
About
About
Staff & Board
Volunteer Corner
Contact
Hours
Location
Get In Touch
Donate
Open Menu
Close Menu
Get Help
How to Help
Overview
Donate Food
Donate Funds
Volunteer
Schedule a Food Pick-up
Host a Food Drive
Logos & Graphics
Learn
LFB by the numbers
Hunger in Ontario
Hunger in Canada
From the Food Bank
Food Waste Matters
Food Bank on Film
FAQ
Our Programs
Arts 4 All Kids
Adopt a Plot
Community Harvest
Plant a Row, Grow a Row
About
About
Staff & Board
Volunteer Corner
Contact
Hours
Location
Get In Touch
Donate
Open Menu
Close Menu
Get Help
Folder:
How to Help
Back
Overview
Donate Food
Donate Funds
Volunteer
Schedule a Food Pick-up
Host a Food Drive
Logos & Graphics
Folder:
Learn
Back
LFB by the numbers
Hunger in Ontario
Hunger in Canada
From the Food Bank
Food Waste Matters
Food Bank on Film
FAQ
Folder:
Our Programs
Back
Arts 4 All Kids
Adopt a Plot
Community Harvest
Plant a Row, Grow a Row
Folder:
About
Back
About
Staff & Board
Volunteer Corner
Folder:
Contact
Back
Hours
Location
Get In Touch
Donate
By The Numbers
2024
2023
2022
2021
2020
2019
2018
2017
2016